Executive Summary
Stock balance reporting is one of the areas where SAP BW and SAP BW/4HANA historically did a lot of work for the modeller. Non-cumulative key figures allowed stock to be analysed at a point in time without forcing every report to manually recalculate the balance from all historical movements.
Modern SAP Datasphere now supports native Non-Cumulative Measures in Analytic Models. However, implementing a complete inventory solution still requires careful modelling of movement data, finance revaluations, stock date generation and business semantics. The model needs to combine stock movements, finance revaluations, a controlled stock date range and cumulative SQL logic before exposing the result through an Analytic Model. This article explains the underlying design principles that remain valuable for custom inventory scenarios and for understanding how native non-cumulative modelling works.
The approach described here is suitable where the number of material, plant, storage location and stock type combinations is manageable, and where the priority is transparent, reconcilable inventory reporting rather than simply replicating a BW design one-for-one.
Editor’s Note (2026)
This article was originally written before SAP introduced native Non-Cumulative Measures in SAP Datasphere Analytic Models. While Datasphere now provides native support for many inventory reporting scenarios, the modelling patterns described here remain useful for understanding stock balance calculations, finance revaluations, SQL window functions and advanced allocation logic.
Business Problem
Inventory reports are usually expected to answer a simple business question: what was the stock quantity and stock value on a given day, week, month or year?
In practice, this is not a simple aggregation problem. Material movements represent inflows and outflows over time. Finance revaluations can change the value of stock without changing the quantity. Users may also want to analyse stock by material, plant, storage location and stock type while still reconciling back to operational reports such as MB52.
If the Datasphere model only sums transactions inside the selected reporting period, the result will usually be wrong. A stock balance is cumulative. The model must calculate the balance up to the reporting date, not only the movements that occurred on that date.
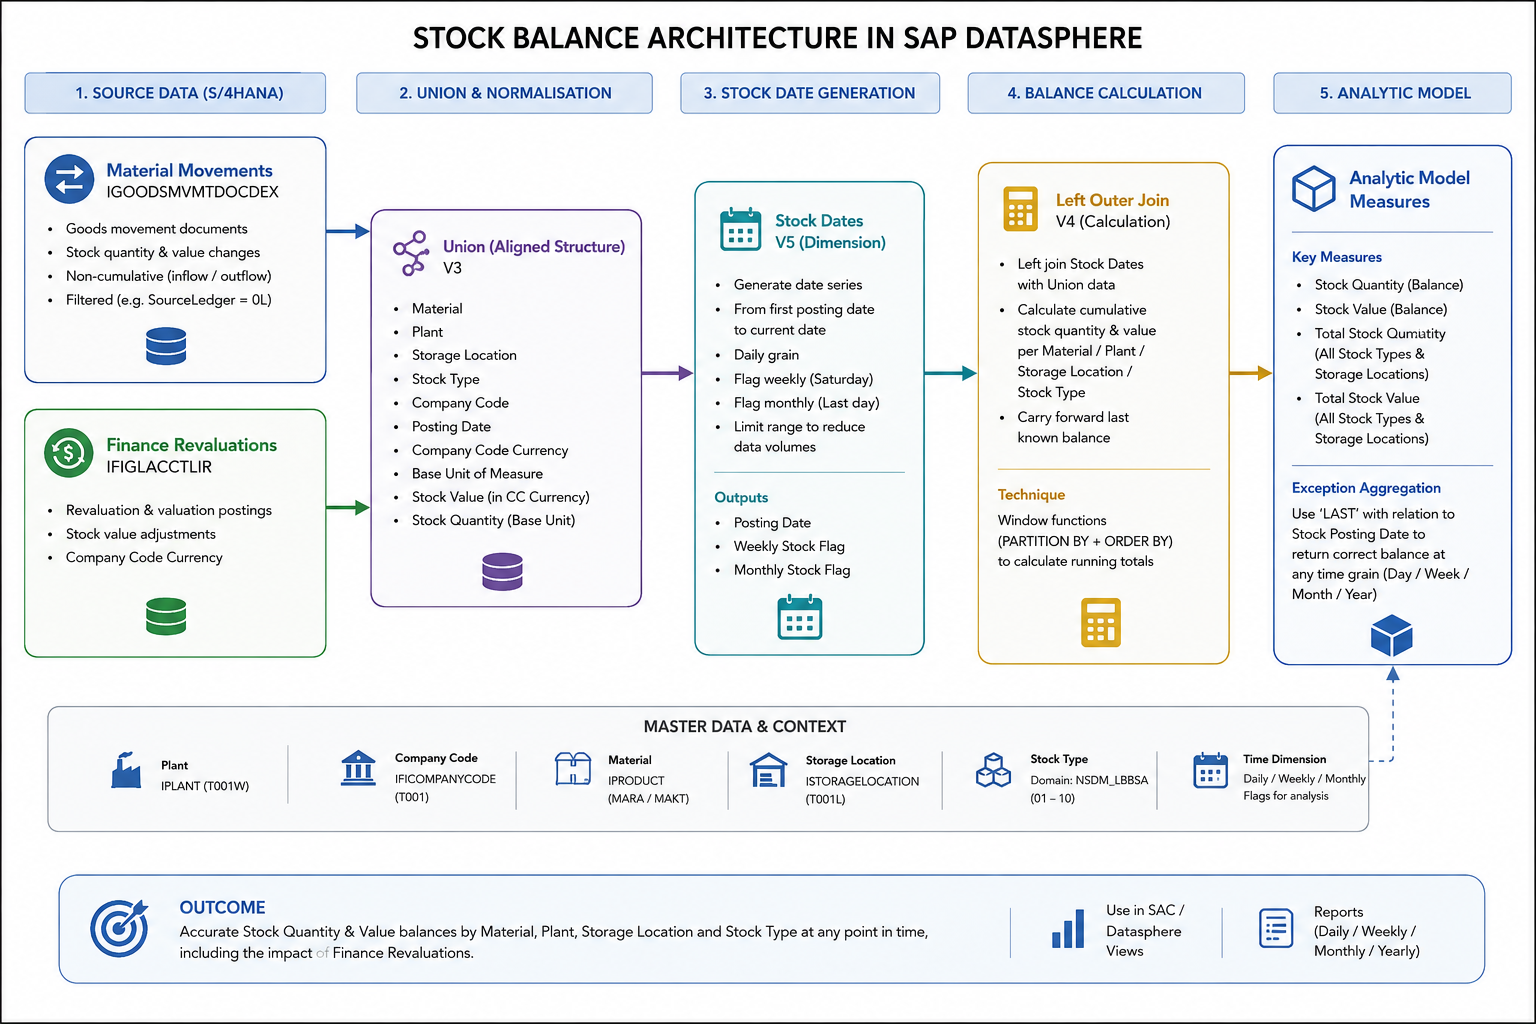
High-level architecture showing material movement data, finance revaluation postings, stock date generation, SQL balance calculation and the final Analytic Model.
Solution Overview
A practical model separates the calculation into a small number of clear layers.
First, material movement data is sourced from the relevant S/4HANA view and aggregated by the stock characteristics required for reporting. This typically includes plant, company code, storage location, material, posting date, inventory stock type, currency and base unit of measure.
Second, finance revaluation postings are sourced separately. These postings affect stock value but not stock quantity, so they should be normalised into the same structure as the movement data before being combined.
Third, the movement and revaluation streams are unioned into a common transaction layer. This gives the model a single place to calculate quantity and value movements over time.
Fourth, a stock date dimension is generated from the first relevant posting date through to the current date. This avoids calculating balances for dates that can never have stock activity, while still allowing users to analyse daily, weekly and monthly stock positions.
Finally, SQL window functions calculate the cumulative balance. The resulting dataset can then be exposed through an Analytic Model using LAST exception aggregation against the stock posting date.
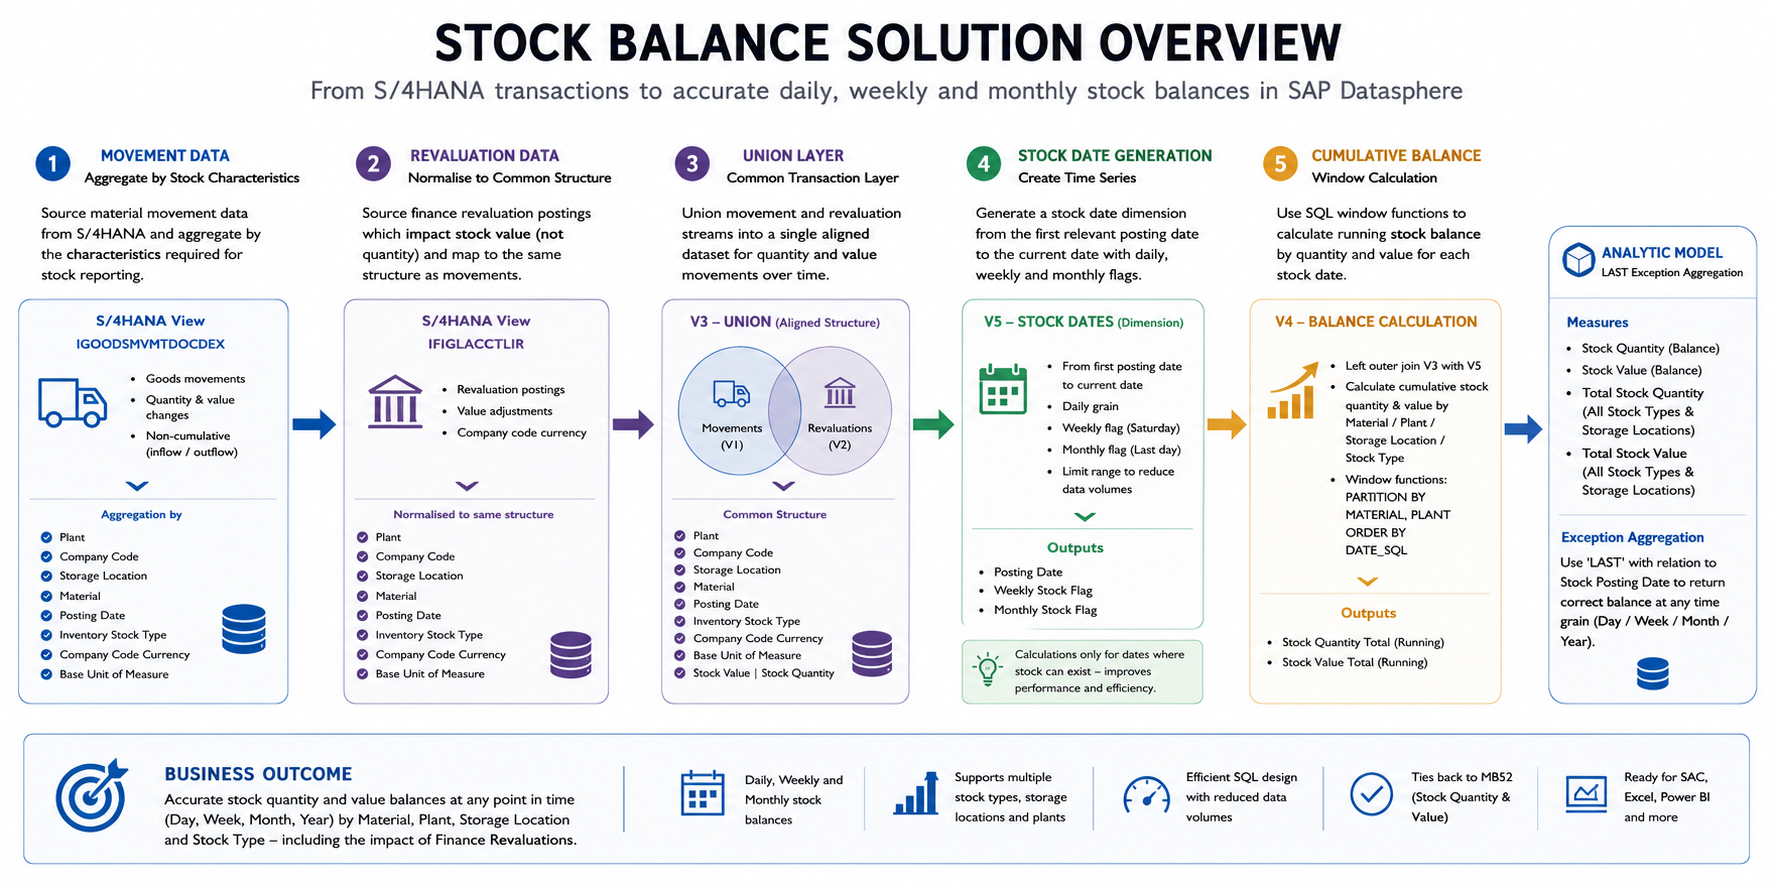
Processing flow showing movement aggregation, revaluation aggregation, union, stock date join and cumulative balance calculation.
SQL Logic
The core of the design is the distinction between transaction movement and stock position.
A goods movement is an event. A stock balance is the result of all relevant events up to a point in time. This is why a stock balance model usually needs a generated date series and a cumulative calculation.
The stock date view should be deliberately constrained. In most cases, there is little value in generating dates before the first material posting. The date range should normally run from the earliest relevant posting date to the current date. Additional flags, such as weekly stock and monthly stock, can be added to simplify validation and non-SAP reporting scenarios.
The SQL balance calculation then uses a running total pattern. In SAP HANA SQL, this is normally implemented with SUM() OVER (PARTITION BY ... ORDER BY ...). The partition defines the stock object being balanced, such as material and plant, and the order defines the stock date sequence.
Where finance revaluations are included, the model also needs to consider that valuation changes may not exist at the same granularity as storage location or stock type. If the business requires stock value by storage location or stock type, the value may need to be derived proportionally from the total stock value and the quantity held at the lower level.
Analytic Model Design
Once the SQL layer has calculated the stock balance by date, the Analytic Model should expose the balance using LAST exception aggregation with reference to the stock posting date.
This matters because users rarely want to keep the stock date in every report. They may want to analyse inventory by month, quarter or year. Without LAST exception aggregation, a report could incorrectly add together daily stock balances across the period.
For example, if stock is 100 units on Monday and 100 units on Tuesday, the monthly balance is not 200 units. The correct month-end balance is the last relevant stock balance in the selected period.
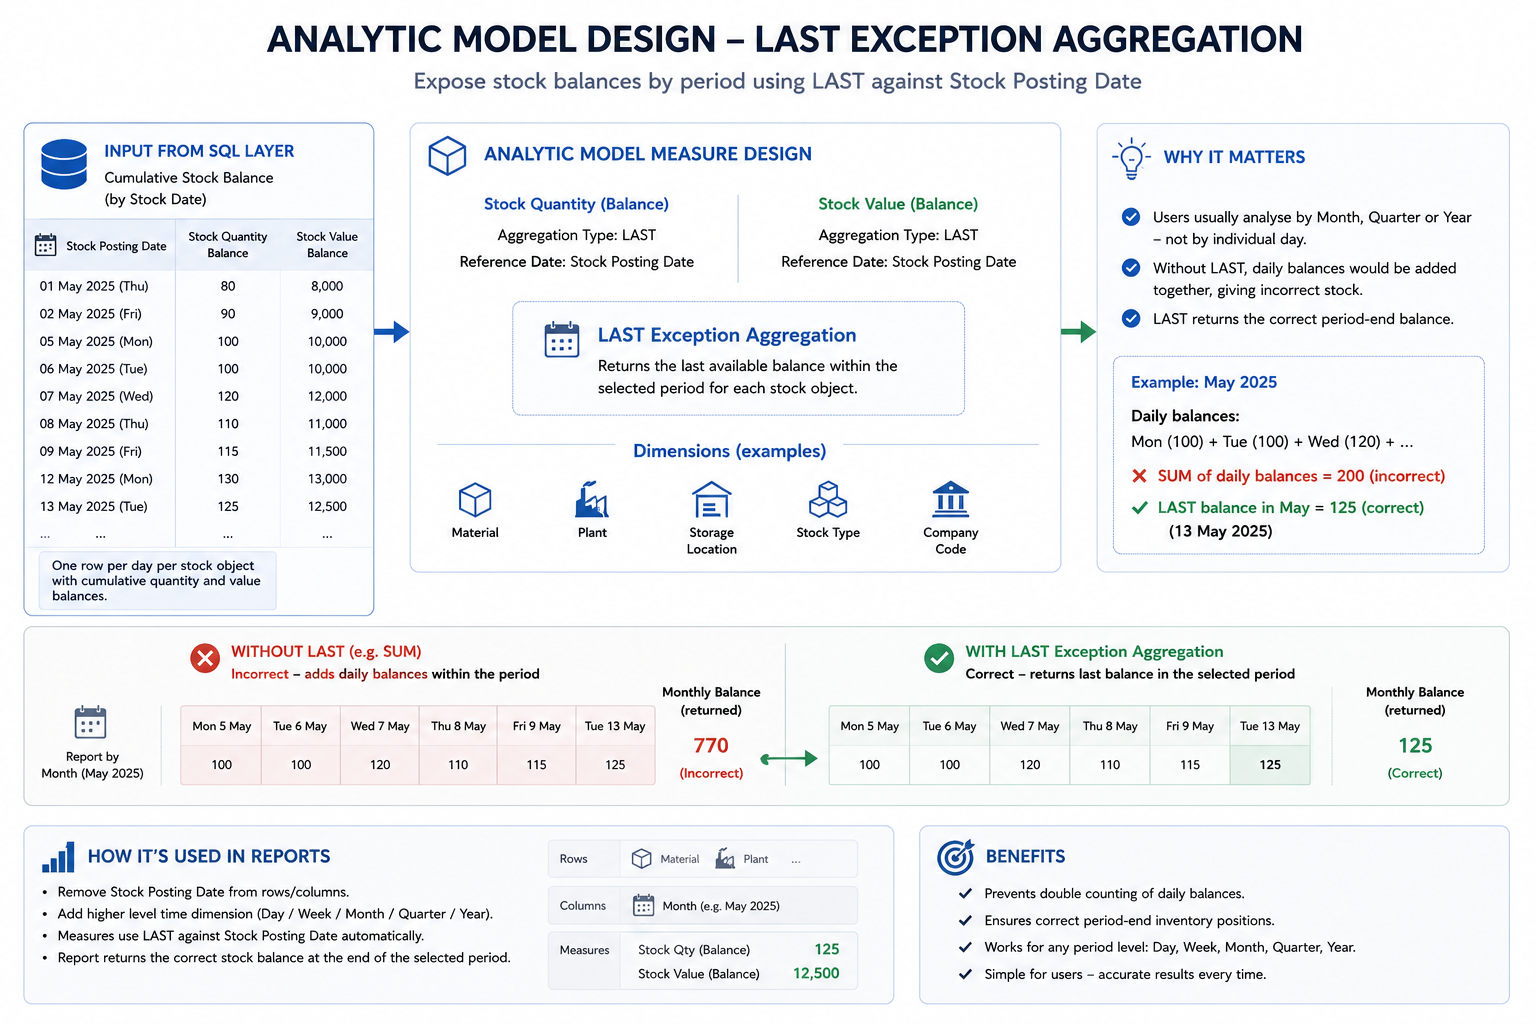
Analytic Model measure design showing stock quantity and stock value exposed with LAST exception aggregation by stock posting date.
Key Design Considerations
The design should be modular. Keeping movement logic, revaluation logic, stock date generation and balance calculation in separate SQL views makes the model easier to test and easier to support.
Data volume also needs to be considered early. A daily stock balance across every material, plant, storage location and stock type combination can become large. For some industries this will be acceptable. For others, especially high-volume retail environments, the design may need additional pruning, partitioning or monthly balance snapshots.
The model should also be reconcilable. Stock quantity and stock value should be validated against known operational or finance reports before the model is extended into dashboards and planning processes.
Common Pitfalls
A common mistake is to treat stock reporting as a normal period aggregation problem. This produces reports that look plausible but fail reconciliation.
Another mistake is to ignore revaluations. This may allow stock quantity to tie out while stock value remains incorrect.
A third issue is generating too many stock dates. If the model creates daily balances for unnecessary historical periods or inactive combinations, performance and storage can deteriorate quickly.
Finally, avoid hiding all logic inside one large SQL script. It may appear faster at the start, but it makes the calculation harder to explain, test and adapt.
Black Barn Recommendation
Model stock balances explicitly and keep the design transparent.
Use separate SQL views for material movements, revaluations, combined transactions, stock dates and cumulative balance calculation. Apply the date range deliberately and only calculate balances at the granularity the business actually needs.
For the Analytic Model, use LAST exception aggregation for stock quantity and stock value so that reporting by week, month and year behaves correctly. Where value needs to be shown below the level of the revaluation posting, document the allocation logic clearly and validate it with finance stakeholders.
Where appropriate, evaluate the native Non-Cumulative Measure capabilities available in modern SAP Datasphere Analytic Models. These simplify many inventory reporting scenarios, but robust SQL modelling, stock date generation and business-specific valuation logic are still required for more advanced implementations.
Conclusion
Although SAP Datasphere now includes native Non-Cumulative Measures, stock balance modelling still benefits from a well-designed data model, particularly where finance revaluations, custom allocation logic or reconciliation requirements exist. The key is to calculate the stock position before reporting on it, rather than expecting the reporting layer to infer the balance from movement transactions.
With a controlled stock date dimension, modular SQL views, cumulative window functions and correct Analytic Model aggregation, SAP Datasphere can deliver useful and reconcilable inventory balance reporting for many scenarios.
Further Reading
SAP documentation
SAP Learning
Need expert help with SAP Datasphere or SAP Business Data Cloud?
Black Barn provides independent architecture, implementation, training and advisory services for SAP Datasphere, SAP Analytics Cloud and SAP Business Data Cloud.