Business problem
Finance users often consume multiple datasets that refresh at different intervals.
For example, a Universal Journal dataset may be replicated using real-time change data capture, while a Group Reporting dataset may be persisted through scheduled flows every few hours. Both datasets can appear in the same reporting landscape, but they do not have the same refresh pattern or monitoring trail.
That creates a common support question:
Has the data refreshed, or is the report showing old numbers?
For business users, the answer should be visible in the reporting layer. They should not need to access the Data Integration Monitor, inspect remote table subscriptions or ask a technical team to confirm the latest load time.
A good Datasphere solution should make data freshness transparent.
Real-Time vs Replicated Data
Not all SAP Datasphere data is updated in the same way.
Real-time tables and persisted datasets have different runtime behaviours and should be monitored differently.
| Area | Real-Time / CDC | Replicated / Persisted |
|---|---|---|
| Typical object | Remote Table subscription | Data Flow or persisted replication |
| Refresh pattern | Continuous or near real-time | Scheduled or on-demand |
| Monitoring area | Data Integration Monitor, Remote Tables | Data Integration Monitor, Flows |
| Typical use case | Operational or near real-time reporting | Periodic reporting, finance snapshots, performance-optimised reporting |
| Monitoring need | Latest subscription activity | Latest successful execution time |
This distinction matters because a single generic “last refreshed” rule can be misleading. The monitoring design should recognise the integration pattern behind each dataset.
Architecture overview
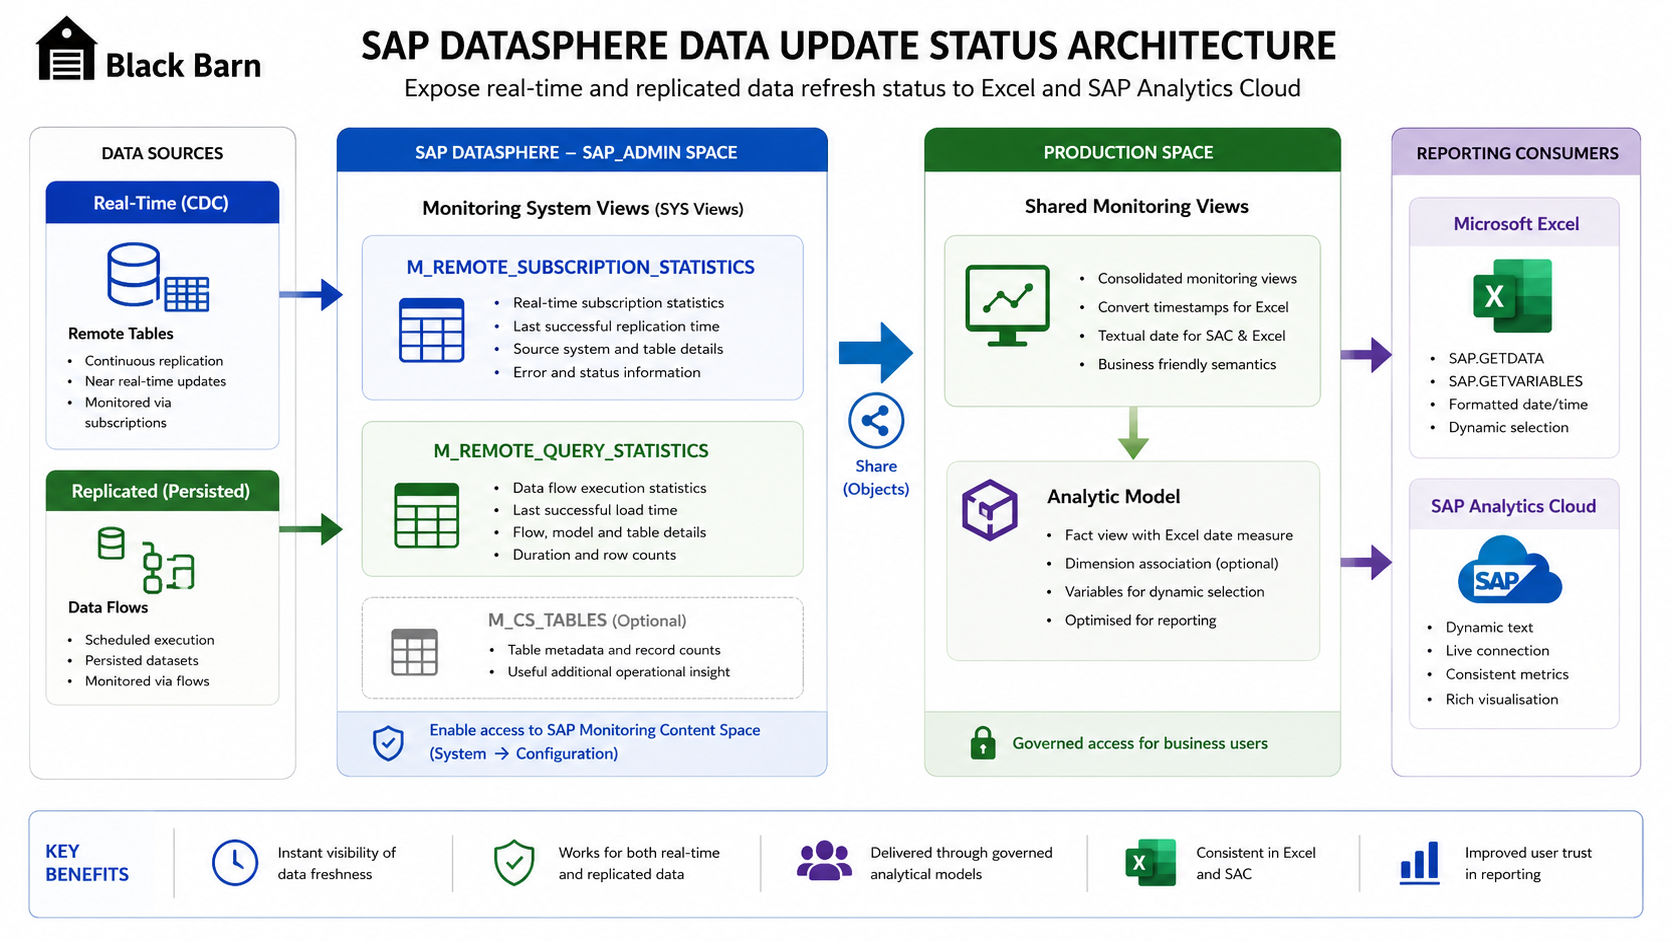
Architecture pattern for exposing real-time and replicated data refresh status through SAP Datasphere monitoring views, an Analytic Model, Excel and SAP Analytics Cloud.
The recommended architecture is deliberately simple.
Monitoring data is read from the SAP Datasphere system views in the SAP_ADMIN space. Technical views are then created to normalise refresh information for both real-time subscriptions and persisted data flows. These views are shared into the production reporting space and exposed through an Analytic Model.
This gives users a governed reporting object instead of direct access to system tables.
The pattern is:
- Enable access to the SAP monitoring content.
- Read the relevant system monitoring views from the SAP_ADMIN space.
- Create SQL views that return dataset name, refresh timestamp and status.
- Convert timestamps into both text and numeric formats.
- Share the views to the reporting space.
- Expose the result through an Analytic Model.
- Consume the refresh status in Excel and SAP Analytics Cloud.
SAP monitoring system views
SAP Datasphere stores monitoring information for integration activity in system-accessible monitoring views.
The exact view depends on the integration pattern.
For real-time subscription monitoring, the useful system view is typically:
M_REMOTE_SUBSCRIPTION_STATISTICSFor persisted or remote query monitoring, the useful system view is typically:
M_REMOTE_QUERY_STATISTICSIn some scenarios, table metadata such as record counts can also be useful:
M_CS_TABLESThe important design principle is not to expose these technical views directly to business users. Instead, use them to build a small, curated monitoring model.
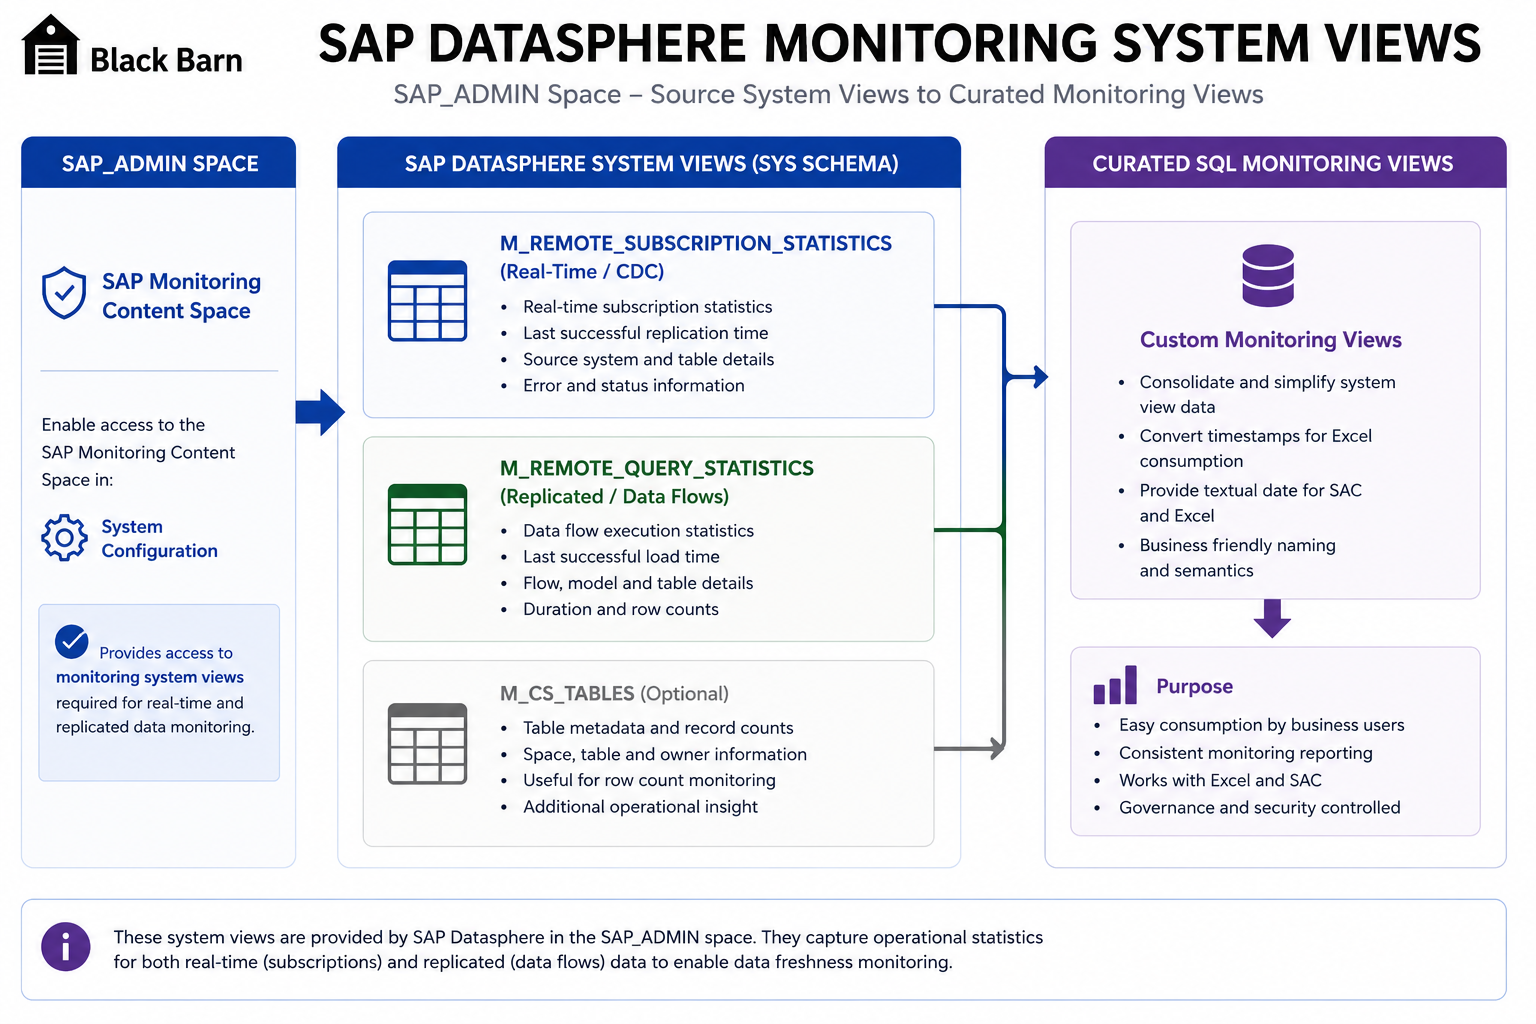
SAP_ADMIN monitoring content and system views used to create curated SQL monitoring views for business consumption.
Converting timestamps for Excel
One of the more practical challenges is that Microsoft Excel reporting through SAP formulas often expects a measure-like value, while timestamps are not always convenient to expose directly as measures.
A useful workaround is to convert the timestamp into an Excel serial date number.
The logic is based on the number of days since 1900-01-01, plus the fraction of the day represented by the time.
Example SQL pattern:
(
  DAYS_BETWEEN(
    TO_DATE('1900-01-01'),
    TO_DATE("END_TIME")
  ) + 2
)
+
(
  SECONDS_BETWEEN(
    TO_TIME('00:00:00'),
    TO_TIME("END_TIME")
  ) / 86400
) AS "EXCEL_DATE_TIME"
This creates a numeric value that Excel can format as a date and time.
For display scenarios, it is also useful to create a formatted text value:
INITCAP(DAYNAME("END_TIME")) || ', ' ||
INITCAP(MONTHNAME("END_TIME")) || ' ' ||
DAYOFMONTH("END_TIME") || ', ' ||
YEAR("END_TIME") || ', ' ||
TO_TIME("END_TIME") AS "DATE_TEXT"
This text version can be used in SAP Analytics Cloud dynamic text or exposed through formula-based Excel scenarios.
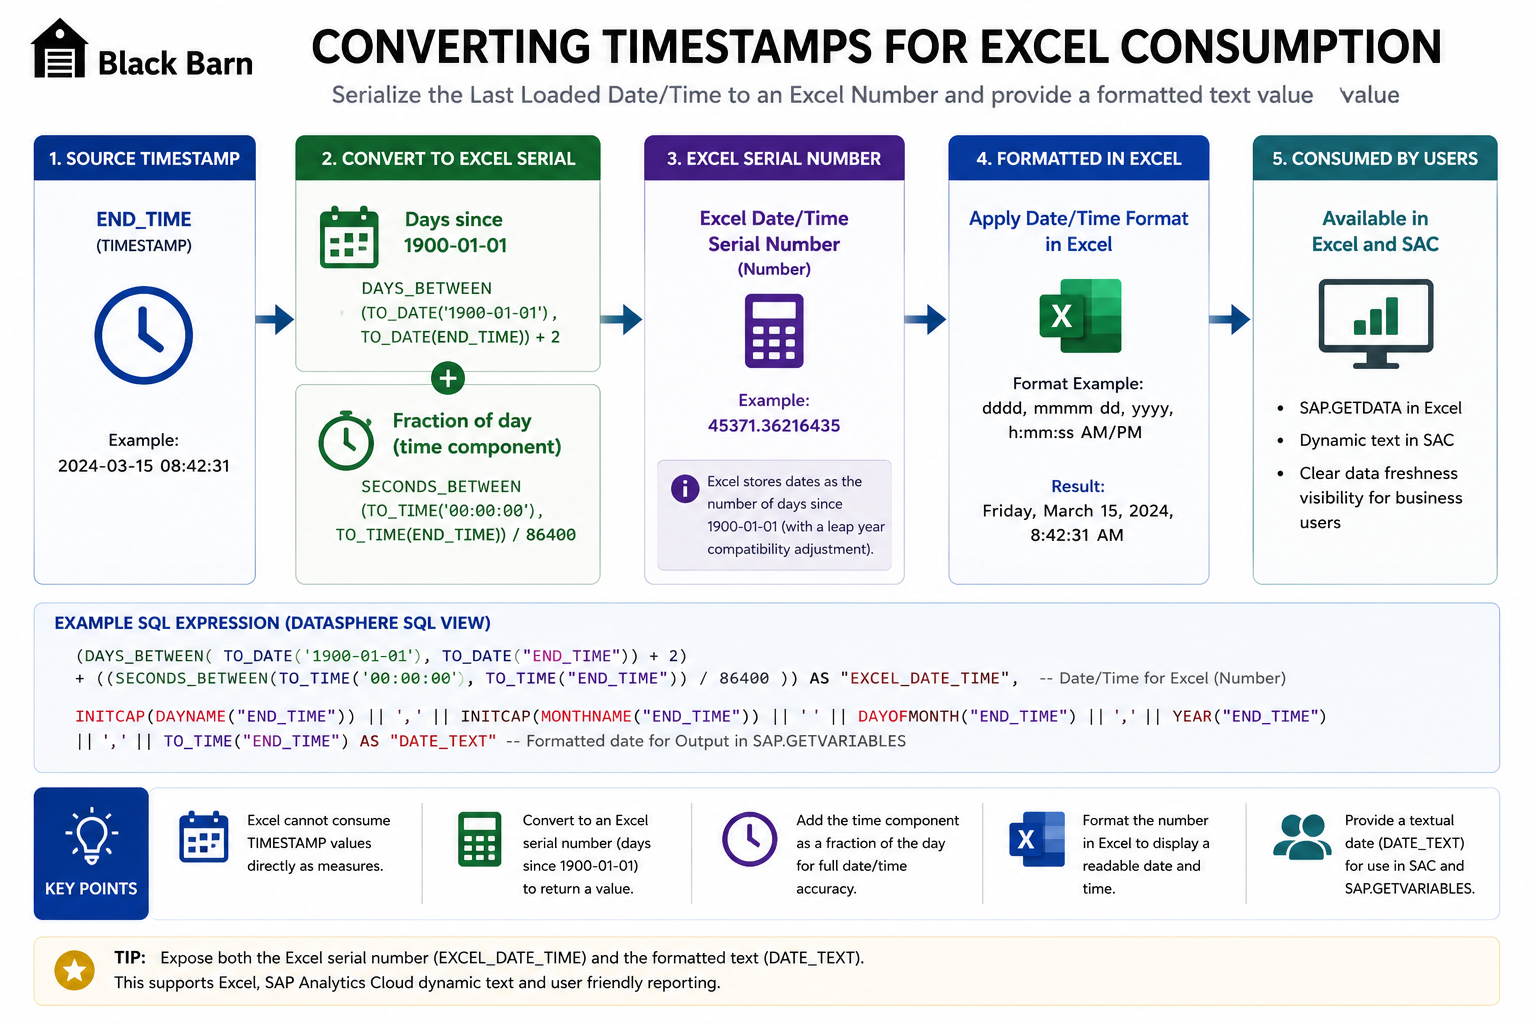
Converting END_TIME into an Excel serial date number and formatted date text for consumption in Excel and SAP Analytics Cloud.
Publishing through an Analytic Model
Once the monitoring views are created, the next step is to expose them through a user-facing semantic layer.
A practical design is:
- Create a fact view containing dataset status and the Excel date measure.
- Create a dimension view for monitored datasets.
- Associate the dimension to the fact view.
- Build an Analytic Model for reporting consumption.
- Add a variable or filter to select the dataset whose status should be displayed.
This allows the refresh status to be consumed consistently by Excel and SAP Analytics Cloud.
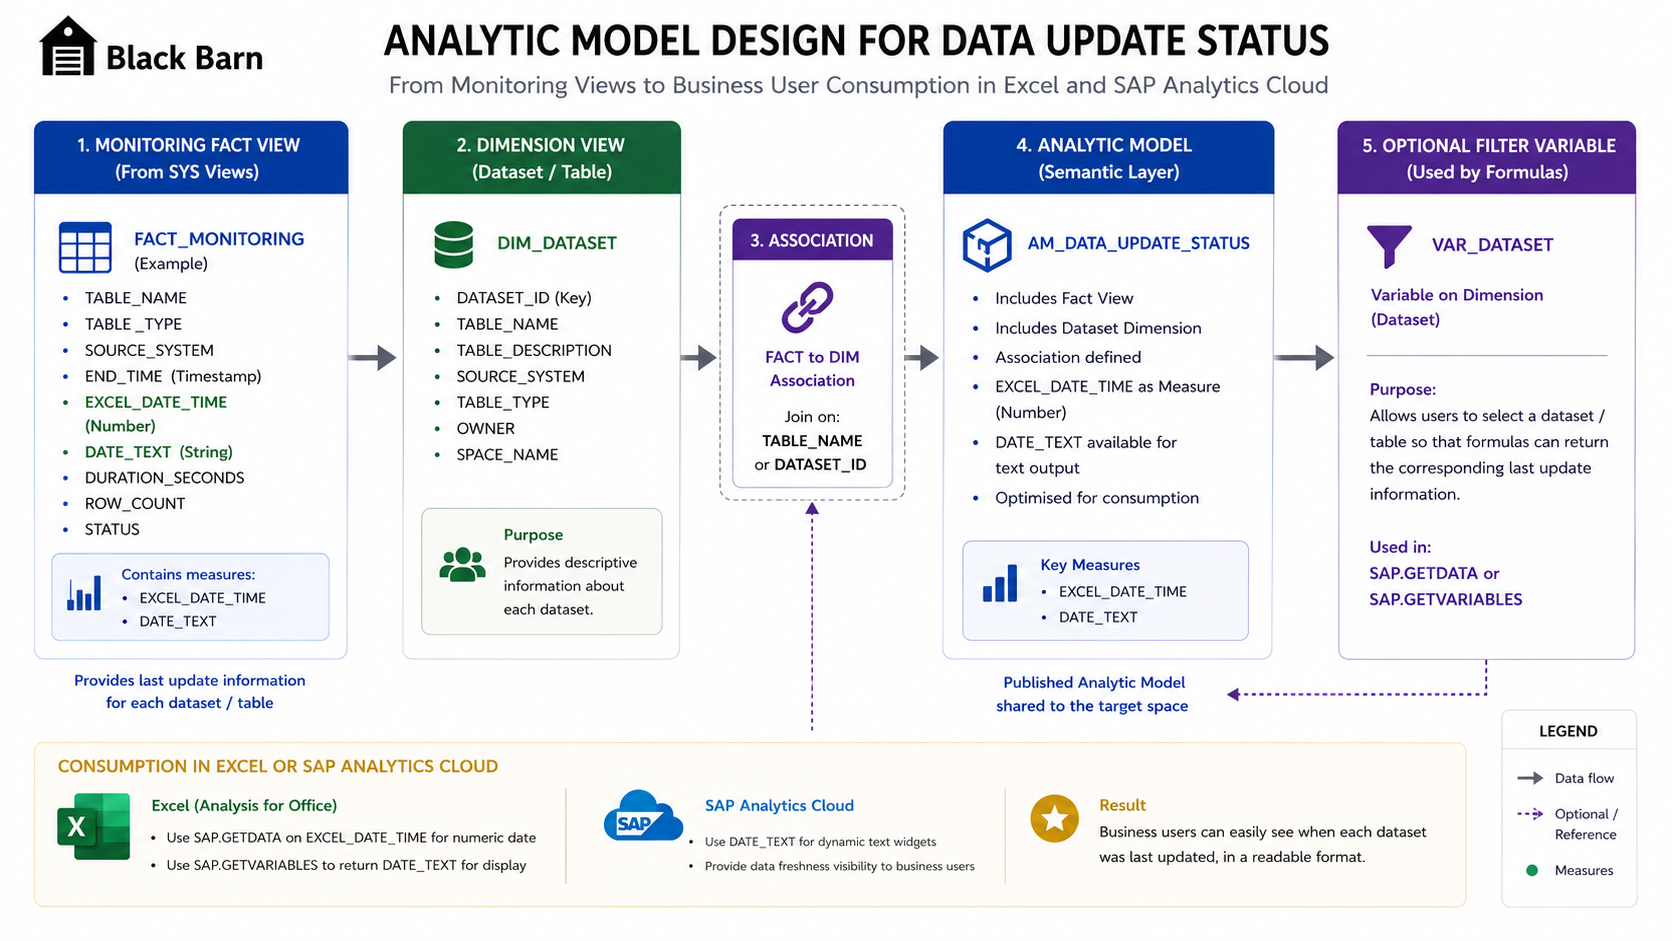
Modelling pattern for exposing refresh status through a monitoring fact view, dataset dimension, association and Analytic Model.
Results in Excel and SAP Analytics Cloud
Once exposed through an Analytic Model, users can access the refresh status in several ways.
In Excel, the numeric serial date can be retrieved and formatted as a date-time value. The formatted text value can also be retrieved for display in a header, status panel or workbook note.
In SAP Analytics Cloud, the same monitoring model can be used to show dynamic text, a small status table or a freshness indicator.
This is particularly useful where reports combine datasets with different update frequencies.
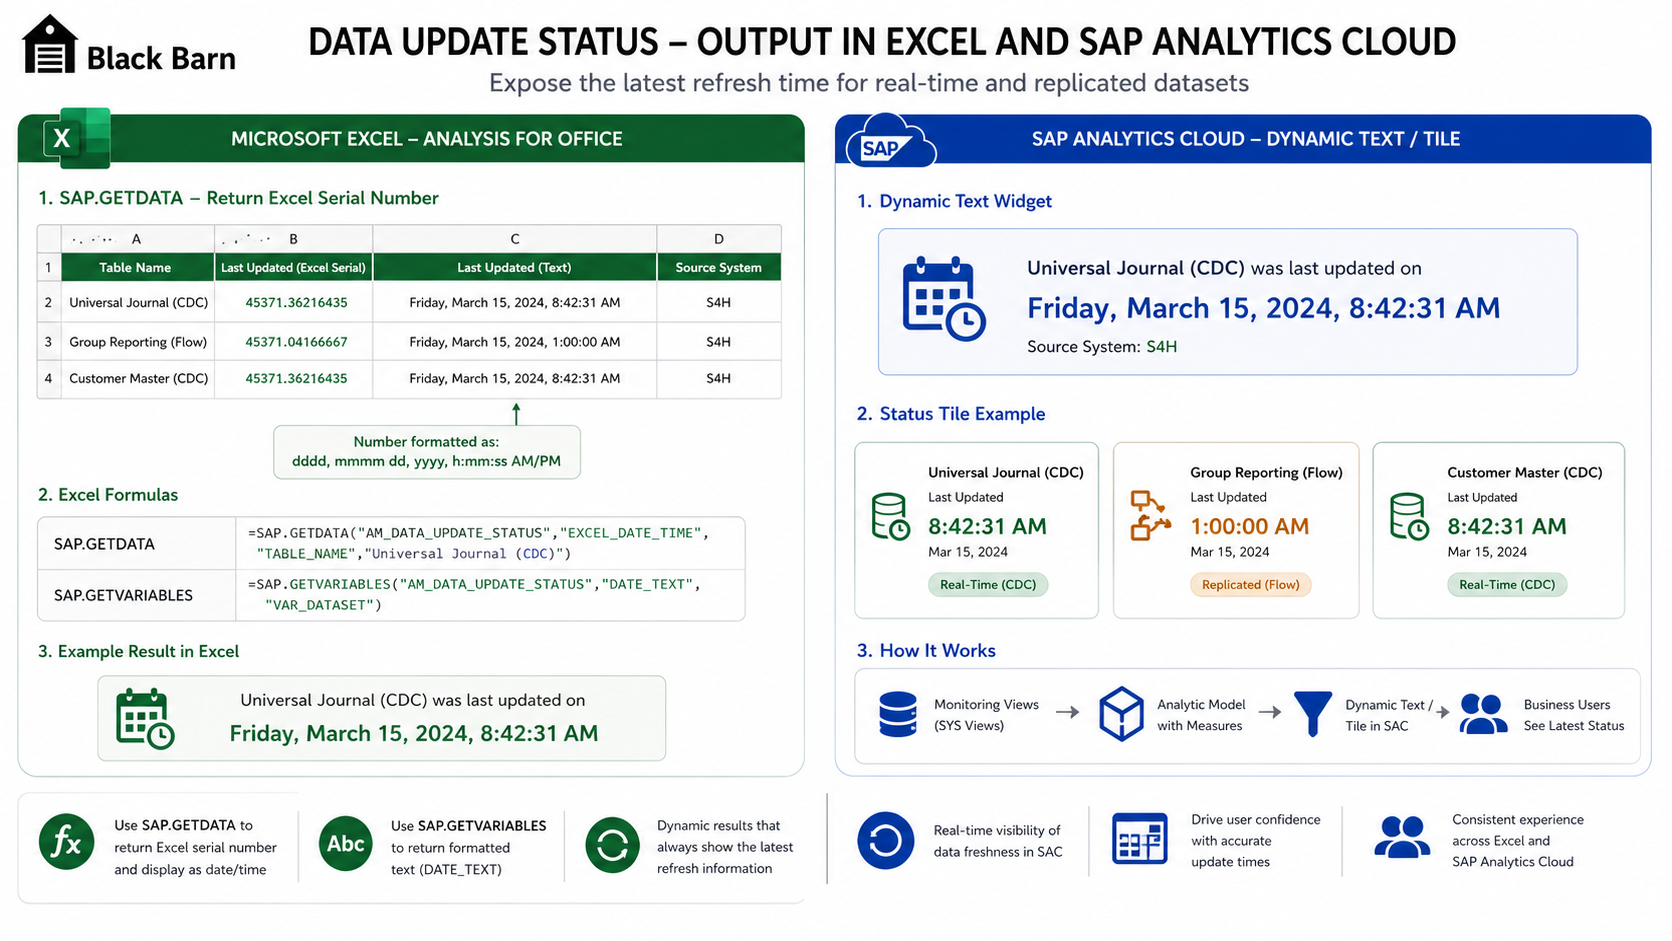
Example output showing refresh status in Excel formulas and SAP Analytics Cloud dynamic text or status tiles.
Practical implementation guidance
Black Barn recommends treating refresh-status reporting as a small governed model rather than a one-off report enhancement.
The implementation should normally include:
- A clear list of monitored datasets.
- A distinction between real-time and persisted datasets.
- A standard output structure for refresh timestamp, status text and source object.
- A numeric Excel date-time measure.
- A formatted date text attribute.
- A simple Analytic Model for Excel and SAP Analytics Cloud consumption.
The model should be reusable so that future datasets can be added with minimal rework.
Performance considerations
This pattern is lightweight when implemented correctly.
The monitoring views are small compared with business transaction tables, and the output is usually a limited list of datasets rather than a high-volume analytical result.
However, there are still a few important considerations:
- Keep the monitoring model focused on the datasets users actually need.
- Avoid exposing raw system monitoring tables directly.
- Filter to the latest relevant execution or subscription state.
- Use clear naming so users understand what is being monitored.
- Avoid mixing data freshness logic into every business reporting model.
The goal is to create one reliable monitoring pattern that can be reused across reporting outputs.
Common pitfalls
The most common mistakes are usually design issues rather than technical limitations.
Avoid:
- Treating real-time and scheduled data as if they refresh the same way.
- Exposing system views directly to business users.
- Returning raw timestamps that Excel cannot easily format.
- Forgetting to enable access to the monitoring content.
- Creating separate custom refresh logic in every report.
- Displaying a last-refresh time without explaining what dataset it refers to.
- Assuming SAP.MEMBERPROPERTY or related Excel formulas always refresh without reconnecting.
A good solution should be explicit, governed and easy for users to interpret.
Black Barn recommendation
Black Barn recommends building a standard data freshness model for every SAP Datasphere reporting landscape that contains mixed real-time and scheduled datasets.
The model should be owned as part of the semantic architecture, not treated as a workbook-only workaround.
The recommended pattern is:
- Use SAP_ADMIN monitoring views as the technical source.
- Create curated SQL views for the monitored datasets.
- Share the views into the production reporting space.
- Expose the result through an Analytic Model.
- Provide both numeric and textual refresh outputs.
- Reuse the same model across Excel, SAP Analytics Cloud and other reporting consumers.
This keeps the reporting experience transparent and reduces support questions around data freshness.
Conclusion
Data freshness is a business requirement, not just a technical monitoring concern.
In SAP Datasphere, users often consume a mixture of real-time and replicated datasets. Without a clear refresh-status model, it becomes difficult for users to know whether a report is showing the latest available data.
By reading SAP Datasphere monitoring system views, converting timestamps into Excel-friendly values and exposing the result through an Analytic Model, organisations can provide a simple and reliable answer to the question: when was this data last updated?
For finance and enterprise reporting scenarios, this small design pattern can significantly improve trust, transparency and supportability.
Further Reading
SAP documentation
- Monitoring Remote Queries | SAP Datasphere Help
- Monitoring Remote Subscriptions | SAP Help Portal
- M_REMOTE_SUBSCRIPTIONS System View | SAP Help Portal
- M_REMOTE_SOURCE_STATISTICS System View | SAP HANA Cloud SQL Reference
SAP Analytics Cloud and Excel formulas
- SAP.GETDATA Function Reference | SAP Help Portal
- Using Formulas in SAP Analytics Cloud Add-in for Microsoft Office | SAP Help Portal
Community resources
Black Barn provides independent architecture, implementation and advisory services for SAP Datasphere, SAP Analytics Cloud and SAP Business Data Cloud.